


Most hiring teams track the number of applicants. Far fewer track what happens to those applicants at every stage between application and hire — which is exactly where the real story lives.
A recruitment funnel conversion rate tells you what percentage of candidates successfully move from one hiring stage to the next. When you measure it at every stage — not just the final hire — you can see precisely where your process is leaking talent, wasting time, and costing money.
This guide breaks down what good looks like at each stage, with 2025 benchmark data from studies covering more than 140 million applications, and what to do when your numbers fall short.
What is a Recruitment Funnel Conversion Rate?
A recruitment funnel conversion rate is the percentage of candidates who progress from one stage of the hiring process to the next. It is calculated using a simple formula:
Conversion Rate (%) = (Candidates in Next Stage ÷ Candidates in Previous Stage) × 100
For example, if 300 candidates applied for a role and 90 were invited to screening, the applicant-to-screening conversion rate is 30%.
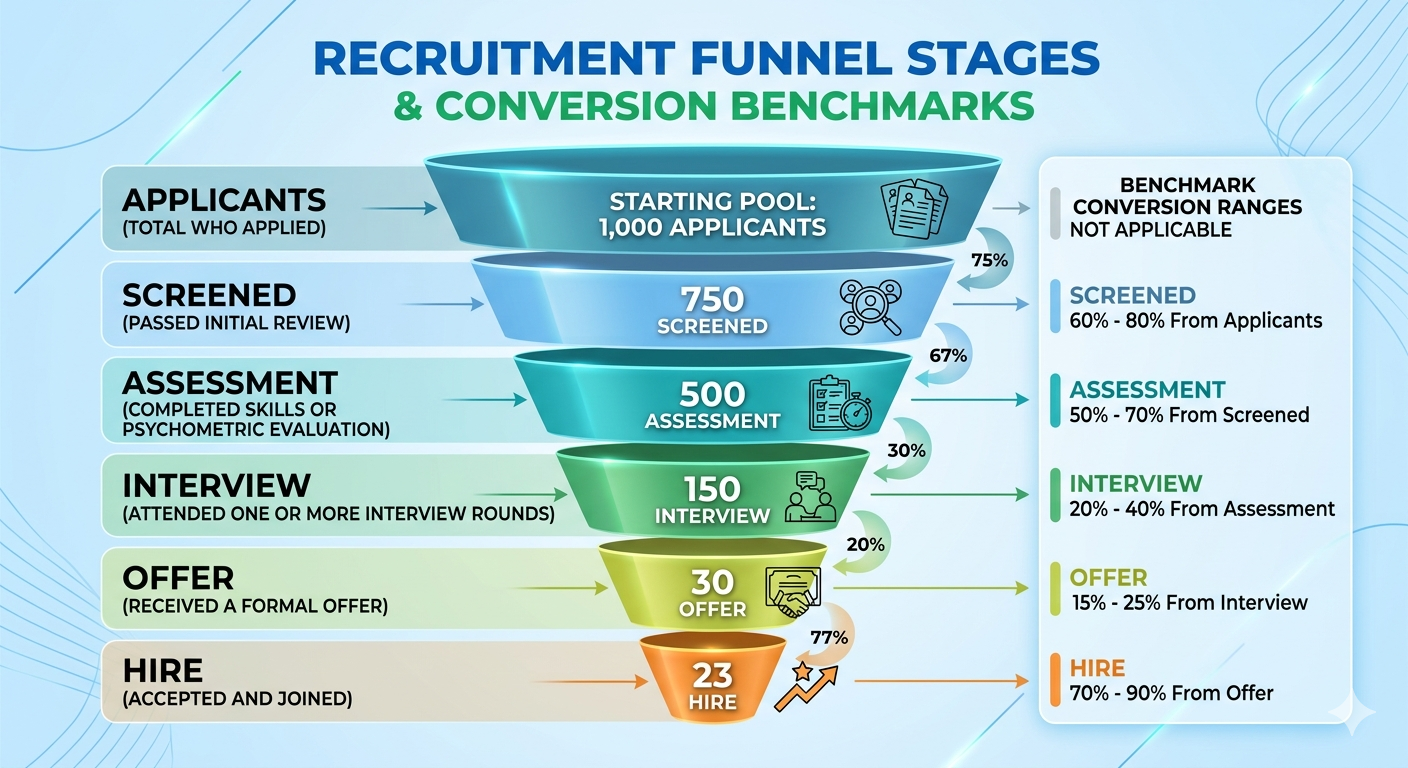
The funnel typically runs through five to six stages:
- Applicants (total who applied)
- Screened (passed initial review)
- Assessment (completed skills or psychometric evaluation)
- Interview (attended one or more interview rounds)
- Offer (received a formal offer)
- Hire (accepted and joined)
Each stage has its own conversion benchmark. Understanding them separately is more useful than looking only at the final applicant-to-hire ratio, because the location of your problem determines the solution.
The Overall Applicant-to-Hire Conversion Rate in 2025
Before going stage by stage, it helps to anchor on the big picture number.
According to CareerPlug's 2025 Recruiting Metrics Report — which analysed over 10 million job applications across more than 60,000 small businesses — employers received an average of 180 applicants for every single hire in 2024. That works out to an overall applicant-to-hire conversion rate of roughly 0.5% to 1%.
Separately, Gem's 2025 Recruiting Benchmarks Report, drawing on data from more than 140 million applicants and 1.3 million hires, found that a prospective applicant is now three times less likely to get hired than they were three years ago. Applications have grown dramatically while hires have not kept pace.
This does not mean something is broken in your funnel. It means the top of the funnel has widened significantly — driven by AI-powered mass-apply tools, one-click apply buttons, and mobile job applications — while the hiring output at the bottom has stayed roughly constant.
What matters more than the overall rate is your stage-by-stage conversion. A funnel that converts 40% at screening and 75% at offer is fundamentally healthier than one that converts 10% at screening and 95% at offer, even if the final hire numbers look similar.
Recruitment Funnel Conversion Benchmarks by Stage
Stage 1: Job Views to Applicants (Click-to-Apply Rate)
Benchmark: 6–10%
This stage measures how many people who see your job posting actually click apply and complete the application. CareerPlug's 2025 data shows the average click-to-apply rate across all industries sat at 6% in 2024, a slight decline from the previous year. HireHive's benchmark data puts the healthy range between 7% and 10%, with anything above 10% considered strong.
That means 90 to 94 out of every 100 people who view your job posting decide not to apply. The biggest drivers of low click-to-apply rates are:
- Job descriptions written as internal requirements documents rather than candidate-facing content
- Application forms with excessive fields — research shows every additional field beyond the basics drops completion by 5–10%
- Mismatched job titles that candidates don't search for or recognise
- Unclear compensation information, which has become a stronger filter as pay transparency expectations grow
What to do if yours is below 6%: Audit your job description first. It is the single highest-leverage change. Then look at your application form length. If candidates are starting the application and abandoning it, you have a friction problem, not a targeting problem.
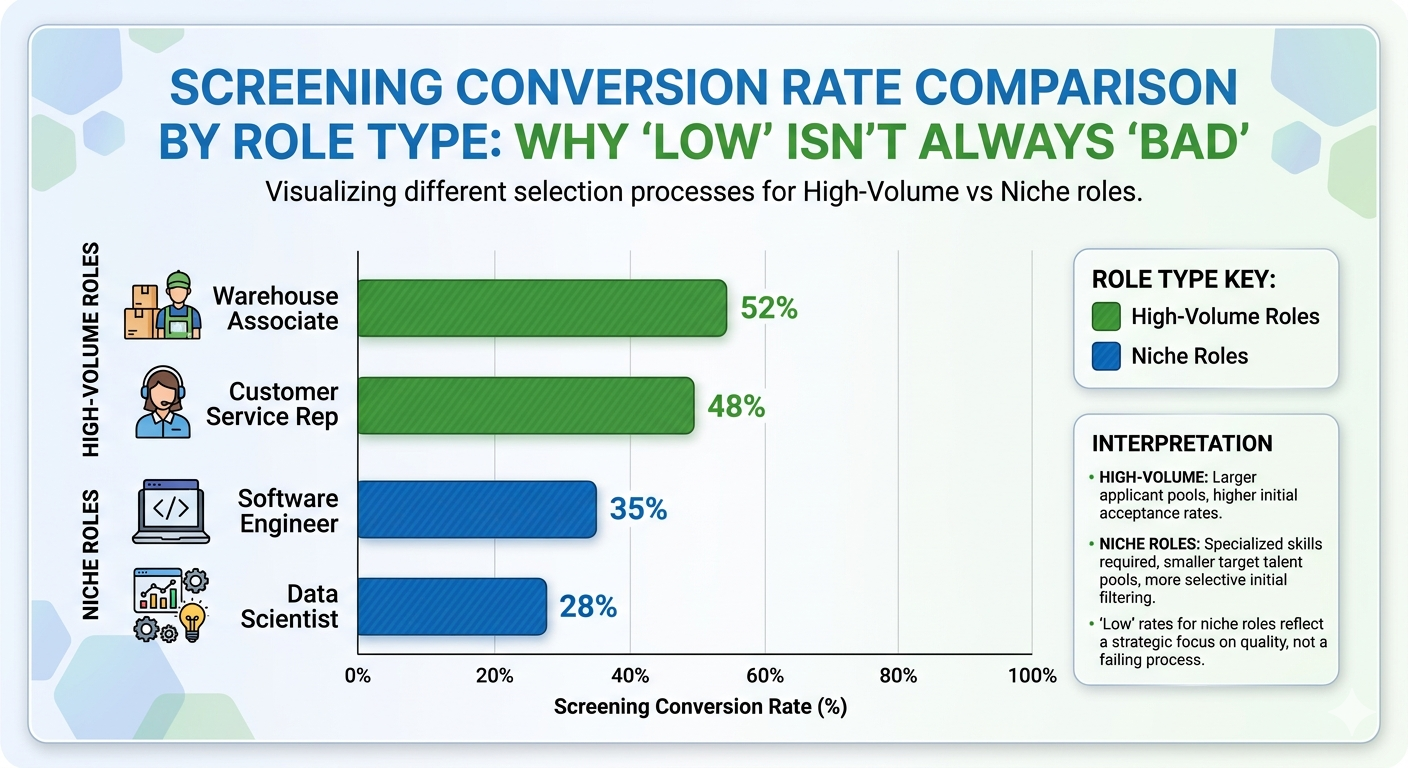
Stage 2: Applicants to Screened (Screening Conversion Rate)
Benchmark: 15–40%
This is the most variable stage in the funnel. CareerPlug's data shows that in 2024, the applicant-to-interview ratio — which includes both screening and interview — was just 3%, meaning only 3 in every 100 applicants were invited to interview. Gem's research across 140 million applicants confirms that passthrough rates have fallen at every stage of the funnel as application volumes have outpaced job openings.
The screening-to-interview split means your screening conversion will typically sit somewhere between 15% and 40% of all applicants, depending on how well your sourcing is targeted. High-volume roles with broad job postings naturally produce lower screening conversion. Niche roles with tight sourcing can achieve 50–60%.
What to do if yours is below 15%: One of three things is usually true. Either your job description is attracting the wrong audience, your screening criteria are too rigid and filtering out qualified candidates, or you have a significant volume of ghost applications — people applying with no real intent. A structured screening tool that scores candidates against defined criteria closes this gap faster than manual review alone.
Stage 3: Screened to Assessment (Assessment Conversion Rate)
Benchmark: 50–70%
For organisations that use pre-employment assessments — skills tests, aptitude tests, psychometric evaluations — this stage measures how many screened candidates complete the assessment. Carv's benchmark data for in-house recruiters places the ideal conversion for early funnel stages at 60–70%, with subsequent stages around 30–40%.
Assessment drop-off at this stage is almost always caused by one of the following: assessments that are too long or too difficult relative to the role, poor candidate communication about what to expect and how long it takes, or assessments sent too late in the process after candidates have already accepted other offers.
What to do if yours is below 50%: First, check assessment length. Anything above 45 minutes dramatically increases abandonment. Second, look at when you're sending the assessment in the timeline. Assessments sent within 24 hours of screening show significantly better completion rates than those sent three or more days later. Third, review your communication — does the candidate understand what the assessment evaluates and why it matters for the role?
Pairing assessments with clear role context and framing them as a two-way evaluation (the candidate learning about the role, not just being judged) consistently improves completion rates.
Use structured assessments that match the role requirements and experience level
Stage 4: Assessment to Interview (Interview Conversion Rate)
Benchmark: 20–40%
This stage tells you how good your assessment is at identifying genuinely qualified candidates. Ashby's 2025 Talent Trends data places interview-to-offer rates at approximately 7% for technical roles and 9% for business roles — but this is the interview-to-offer rate, not assessment-to-interview.
Carv's benchmarks for in-house teams suggest that converting 20–40% of assessed candidates to interview reflects a well-calibrated assessment. Below 20% suggests either the assessment threshold is too high for the role, or the assessment is measuring the wrong things.
Gem's research found that teams now conduct 42% more interviews per hire than they did three years ago — a sign that many organisations are over-interviewing rather than fixing their upstream screening and assessment stages.
What to do if yours is below 20%: The problem is usually one of calibration. Either the assessment pass mark is set too high (producing false negatives — candidates who would have succeeded but scored just below the cutoff), or the assessment doesn't align closely enough with the actual demands of the role. Reviewing a sample of rejected candidates' assessment scores against their application quality often reveals where the misalignment sits.
Stage 5: Interview to Offer (Offer Rate)
Benchmark: 20–40% (general); 7–9% for competitive technical roles)
This is where the funnel tightens most sharply in high-competition sectors. Ashby's 2025 data shows interview-to-offer rates of roughly 7% for technical roles and 9% for business roles at companies using rigorous multi-stage processes.
For organisations with leaner interview processes — one to two rounds — the offer rate will be higher. Carv benchmarks a healthy interview-to-offer ratio at between 2:1 and 4:1, meaning for every 2–4 people interviewed, one offer is extended.
One structural problem that inflates this stage's cost is interview round inflation. Gem's data shows teams average 42% more interview rounds per hire than in 2021. More rounds do not produce better hiring decisions — they produce slower processes that lose candidates to competitors.
What to do if yours is below 20%: Audit interview consistency first. When different interviewers assess the same candidate against different criteria with no structured scorecard, the result is high variance in decisions and a low offer rate. Standardising interview questions and using structured scoring narrows the gap between interviewers and increases the percentage of interviewed candidates who convert to offers.
Standardise your interviews with AI-powered evaluation
Stage 6: Offer to Hire (Offer Acceptance Rate)
Benchmark: 70–90% (varies significantly by industry)
This is the stage most hiring teams feel personally about — and where compensation strategy gets blamed even when it isn't the root cause.
SmartRecruiters' 2025 Recruiting Benchmarks Report, which examined nearly 90 million applications across 95 countries, found that manufacturing leads with a 92% offer acceptance rate. Technology and healthcare lag closer to 77%, primarily due to competitive counter-offers in tech and extreme optionality for healthcare professionals. SmartRecruiters' US-specific data found that one in five US candidates declines the job offer — a 9% lower acceptance rate than the global average.
Jobvite's benchmark data shows offer acceptance rates dropping from a sustained 80% range to roughly 50% in recent years across some sectors, driven by candidates receiving competing offers during slow-moving processes.
The most important finding from this stage: speed matters more than compensation for offer acceptance. Cronofy's 2024 Candidate Expectations Report, which surveyed 12,000 candidates across 7 countries, found that 42% of candidates withdraw from recruiting processes when interview scheduling takes too long. Nearly half of offer-stage losses may have nothing to do with the salary number — they happen because the process was slow enough for the candidate to accept something else first.
| Tool | Main Focus | Main Features | Pricing | Best Use Case | Key Benefits | Integrations |
|---|---|---|---|---|---|---|
| Metaview | Interview intelligence | Structured notes, auto scorecards, coaching insights | $50–$60/month | Recruiting teams | Saves time, faster evaluations | Greenhouse, Lever |
| SkillSauce | AI assessments | 100K+ tests, AI interviews, proctoring, ATS ranking | Free, ₹4,219, ₹8,438 | Volume hiring | Faster hiring, better quality | ATS integrations |
| LinkedIn Talent Insights | Market analytics | Talent pool data, workforce insights | Enterprise | Strategic hiring | Large-scale data | LinkedIn ecosystem |
| Greenhouse | ATS analytics | Reports, dashboards, diversity tracking | Enterprise | Structured hiring | Better hiring decisions | 400+ tools |
| Workday | HCM analytics | Workforce analytics, planning tools | Enterprise | Large orgs | Improves efficiency | HR systems |
What to do if yours is below 70%: Run a post-decline survey. In most cases, you will find one of three things: the compensation was not competitive (fix with better benchmarking, use the SkillSauce Average Salary Calculator to validate your offer ranges), the process took too long, or the candidate experience was poor enough to create doubt about the company. The salary benchmark problem is the easiest one to solve. The speed problem requires process redesign.
How Industry Changes Your Benchmark Expectations
One of the most common mistakes hiring teams make is benchmarking themselves against a generic average rather than their own industry.
According to Pinpoint HQ's Q4 2025 industry data, technology roles require more than four times the applicant volume that healthcare roles do. CareerPlug's analysis of 10 million applications shows that employers in automotive see around 234 applicants per hire, while education and childcare employers see just 57.
What this means practically:
Technology companies should expect lower conversion at every stage — more applicants, more screening volume, more competitive offer dynamics. A 0.5% overall applicant-to-hire rate in tech is not a broken funnel. It is the industry norm.
Healthcare and education companies should expect higher conversion rates across the funnel. A 2% applicant-to-hire rate in healthcare or childcare roles is achievable and represents a well-functioning process.
Manufacturing companies tend to see fewer applications per opening (SmartRecruiters found 38 applicants per hire in manufacturing vs 73–74 across all industries), but compensate with the highest offer acceptance rates in any sector.
The benchmark comparison that matters is your funnel today versus your funnel three months ago — and your funnel versus your industry peers, not the global average.
The Hidden Metric: Time-to-Hire and Funnel Velocity
Conversion rates measure the quality of your funnel. Time-to-hire measures its velocity. Both matter, because a slow funnel bleeds conversion at every stage.
Ashby's 2025 Talent Trends Report, covering 31 million applications across 95,000 jobs, found that average time-to-hire has increased 24% since 2021, climbing from 33 to 41 days. The primary driver is not longer individual interview stages — it is more interview rounds per hire.
SHRM's 2025 Benchmarking Report puts the median US time-to-fill at 45 days, with technology and financial services roles taking 48–49 days and manufacturing closer to 42.
The consequence is not just inconvenience. Cronofy's 2024 data showing 42% candidate withdrawal during slow scheduling processes means that time-to-hire directly suppresses your offer acceptance rate. The two metrics are not independent — they compound.
A practical target: Aim to move candidates from application to first response within 24 hours, from screening to assessment within 48 hours, and from final interview to offer within one week. Teams that hit those three internal targets consistently outperform their industry benchmark at the offer stage regardless of how competitive their compensation is.
Why Your Funnel Numbers May Be Misleading
Three situations produce funnel data that looks fine on paper but hides real problems:
Source mix distortion. CareerPlug's 2025 data shows that job boards produced 61% of applications but only 42% of hires, while company career pages generated just 13% of applicants but 26% of hires — meaning career page applicants are roughly four times more likely to be hired. If your applicant source mix shifts heavily toward job boards, your screening conversion will naturally fall without anything in your actual process changing.
Sourced vs inbound applicant mix. Gem's research found that sourced (outbound) candidates are five times more likely to be hired than inbound applicants. As teams do more proactive sourcing, overall conversion rates go up — but this reflects sourcing quality, not process improvement.
Ghost applications. Candidate ghosting — where applicants submit applications with no real intent and then stop responding — artificially inflates your applicant count and suppresses your screening conversion rate. This has become a significant issue at every level of the market.
Understanding your source mix and separating inbound from sourced candidates in your funnel analysis gives you a much more accurate picture of where real improvements are possible.
How to Calculate and Track Your Own Recruitment Funnel Conversion Rate
Tracking your funnel does not require sophisticated software. The core formula applies at every stage:
Conversion Rate (%) = (Candidates who advanced ÷ Candidates who entered that stage) × 100
Apply it to every stage in sequence:
- Screened ÷ Total Applicants = Screening Conversion Rate
- Assessed ÷ Screened = Assessment Conversion Rate
- Interviewed ÷ Assessed = Interview Conversion Rate
- Offered ÷ Interviewed = Offer Rate
- Hired ÷ Offered = Offer Acceptance Rate
- Hired ÷ Total Applicants = Overall Funnel Conversion Rate
Once you have these numbers, compare each stage against the benchmarks in this article. The stage with the widest gap from benchmark is your highest-priority fix.
Summary: Recruitment Funnel Benchmarks at a Glance
| Funnel Stage | Benchmark Conversion Rate | Primary Failure Signal |
|---|---|---|
| Job views → Applicants | 6–10% | Long application form, weak job description |
| Applicants → Screened | 15–40% | Poor targeting, wrong audience, ghost applications |
| Screened → Assessment | 50–70% | Assessment too long, poor timing, weak communication |
| Assessment → Interview | 20–40% | Miscalibrated pass mark, wrong assessment type |
| Interview → Offer | 20–40% (7–9% for tech) | Too many rounds, inconsistent evaluation criteria |
| Offer → Hire | 70–90% | Slow process, non-competitive compensation, poor candidate experience |
| Overall (applicants → hire) | 0.5–2% | Varies significantly by industry and role type |
FAQ