


Introduction
You might be surprised to learn how tracking the right recruitment metrics can make your hiring process better. The numbers tell an interesting story - 92% of candidates who click 'Apply' never finish their application. Another 40% give up when they find applications aren't mobile-friendly.
These aren't just random numbers on a page. They represent talented people your company misses out on. Each candidate who drops off affects your finances, considering the average cost per hire is $4,000. IT roles are a big deal as it means that reaching peak productivity costs $37,000. The challenge grows when one in 10 workers back out after signing their contracts.
Your recruitment funnel metrics are vital to success. When you track specific data points throughout your recruitment funnel, you can spot exactly where and why candidates leave. Companies taking a strategic approach to hiring make quality hires three times more often. Those who create positive experiences for candidates see their reapplication rates jump by 80%.
This piece will walk you through eight recruitment metrics that make a difference. You'll learn about tracking them with a recruitment metrics dashboard and discover ways to boost your conversion rates at every stage. Our Applicant Funnel Calculator helps turn your hiring data into practical steps that cut costs and lead to better hires.
What Are Recruitment Metrics and Why They Matter
Recruitment metrics form the backbone of any data-driven hiring strategy. These measurable indicators help track, manage, and optimize your organization's hiring process. Hard data works better than gut feelings or assumptions to show how well your recruitment team performs.
Recruitment metrics include various data points that help review everything from position filling time to candidate hiring costs. These numbers show which recruitment functions work well and where improvements are needed.
The fundamental value of recruitment metrics helps turn intuition into informed decision-making. Experience remains crucial in recruitment, but data adds accuracy and predictability to your hiring decisions. Your team can spot strengths and weaknesses in the hiring process by analyzing these metrics. This analysis helps hire better candidates faster and at lower costs.
The financial aspect of recruitment metrics deserves attention. PwC reports that HR costs make up about 28% of a company's total operating expenses. SHRM's findings show replacing an employee can cost 50-60% of their annual salary. These numbers show why tracking metrics carefully helps control costs.
Here's something to think about: Glassdoor's estimates put the US recruiting cost per new hire at around $4,000. Northwestern University research reveals that a bad hire costs about 30% of their expected yearly earnings. Companies have strong financial reasons to watch their recruiting success and focus on quality hires.
Recruitment metrics offer value beyond just finances. These measurements help your organization:
- Arrange recruitment strategy with business goals - 98% of Fortune 500 firms employ an applicant tracking system to screen resumes, giving leaders access to valuable data needed to generate these metrics and make strategic workforce decisions
- Improve candidate experience - Over half of all candidates quit the hiring process because they don't feel involved, making metrics that track candidate engagement vital
- Optimize resource allocation - Finding the most successful sourcing channels helps recruitment teams spend their budgets wisely
- Improve overall hiring quality - Analyzing metrics like quality of hire and first-year attrition helps refine your selection process for better outcomes
The recruitment funnel metrics show the trip candidates take from application to hire. Tracking conversion rates between each stage reveals potential bottlenecks. This insight leads to targeted improvements instead of complete process overhauls.
A recruitment metrics dashboard creates one place to watch performance across all key indicators. These dashboards give an all-encompassing view of your recruitment efforts. Teams can spot trends, find areas needing work, and share findings with stakeholders easily.
Companies that accept analytical recruitment put themselves ahead in today's competitive talent market. About 70% of hiring managers stress the need for data-based recruitment approaches. They know decisions backed by solid metrics work better than pure intuition.
Creating a system to track these metrics doesn't need to be complex. Starting with a recruitment metrics template that has the key measurements for your organization gives quick visibility. This foundation supports more advanced tracking as your processes grow.
Measuring recruitment matters because it affects the entire business. Efficient recruitment saves time and resources, which helps your company's profits. These metrics also shape hire quality, team dynamics, productivity, and company culture.
8 Recruitment Metrics That Actually Matter
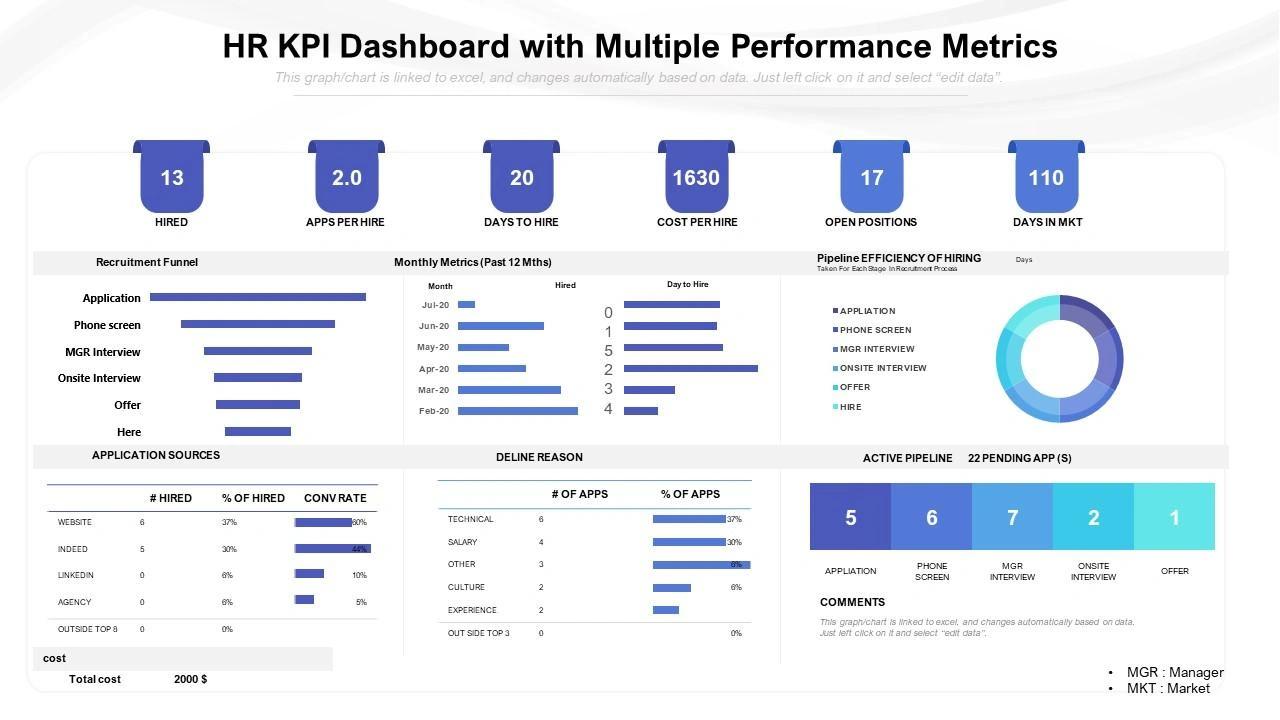
Image Source: SlideTeam
Your hiring outcomes improve when you track the right recruitment metrics. These eight metrics are a great way to get applicable information about your recruitment process instead of getting lost in numbers.
1. Time to Fill
Time to fill counts the days between job requisition approval and candidate acceptance. This vital metric suggests how well your recruiting process works. SHRM data shows the average time to fill takes 41 days across companies of all sizes. You can spot bottlenecks in your recruitment pipeline and help hiring managers set realistic timeline expectations by tracking this number.
2. Time to Hire
Time to hire differs from time to fill. It measures the days from application to offer acceptance and shows your recruiting team's speed and candidate experience quality. Most companies take 20-30 days to hire, though this changes by industry. Tech companies lead the pack with around 20 days.
3. Source of Hire
Source of hire shows where your best candidates come from. This helps you spend your recruitment budget wisely across job boards, employee referrals, career pages, and social media. The best practice combines tracking both candidate sources and hire sources. Candidates often check multiple channels before they apply.
4. Cost per Hire
This number adds up all recruitment costs divided by total hires. U.S. companies spend about $4,700 on average cost per hire. Technical roles can cost more than $6,000. The total includes internal costs like recruiter salaries and external expenses such as job posts. Tracking this helps you save money while finding great candidates.
5. Quality of Hire
Quality of hire measures how much value new employees add based on their performance, culture fit, and how long they stay. This score tells you if your hiring process finds candidates who succeed long-term. Most companies combine several factors into one quarterly score.
6. Offer Acceptance Rate
The percentage of candidates who accept your job offers shows how attractive your positions are. The average acceptance rate reached 81% in 2023. Business roles get 11% more acceptances than technical positions. A drop in this rate might mean your pay isn't competitive or job descriptions need work.
7. Application Completion Rate
Only 10.6% of started applications get submitted. This means 9 out of 10 potential applicants leave before finishing. Applications with more than 50 questions see even worse results - just 5.7% completion. A simple application process that works well on mobile phones can boost these numbers by a lot.
8. First-Year Attrition
First-year attrition shows how many new hires leave within their first year. This is a big deal as it means that 38% of employees quit in year one (40% in the first 90 days). Replacing these employees costs 50-200% of their yearly salary. This makes it the most expensive hiring mistake to fix.
A recruitment dashboard that tracks these eight metrics helps you learn about ways to improve your hiring process. Each metric connects to others - better application completion rates and source effectiveness lead to higher quality hires and fewer first-year departures.
How to Track These Metrics Accurately
Tracking recruitment metrics needs the right tools and a methodical approach. A well-laid-out system helps you get meaningful insights from your recruitment data that lead to better hiring decisions. Let me show you the best practices to track recruitment metrics accurately.
Use a recruitment metrics dashboard
Recruitment dashboards work as the command center for your hiring data and show vital recruitment KPIs in an easy-to-understand visual format. These dashboards are "a collection of information—one place where you can see everything and understand your performance as a recruiter and the performance of your recruiting team". Your recruitment data stays in one place, so you don't need to search through multiple reports from different systems. This saves time and boosts productivity.
A good dashboard makes your recruiting operations transparent. Everyone from recruiters to CEOs can quickly see if hiring is efficient, predictable, and fair. About 94% of companies that use an ATS say their hiring process has improved. These systems help track and report metrics better.
Set clear definitions and formulas
Standard definitions and calculation methods help everyone understand metrics the same way. Take time to hire as an example - you need to be clear if it starts when you identify a candidate or when they submit an application. Cost per hire should include internal costs like recruiter salaries and manager time, plus external costs like job postings and agencies.
Quality of hire needs a formula that combines job performance, cultural fit, ramp time, and engagement levels. This creates a reliable baseline you can check every quarter. Your recruitment analytics stay accurate when you standardize form fields and check data quality regularly.
Track data consistently across teams
Teams that share data create a complete picture of recruitment performance. A single source of truth for metrics lets stakeholders work with the same information. Data quality checks are crucial because "the information you're seeing in your dashboard is only as good as the information you input into it".
The team needs quick training sessions to learn how to collect, handle, and use data properly. This shared knowledge promotes a culture of using data throughout your organization.
Use SkillSauce's Applicant Funnel Calculator
An applicant funnel calculator maps out your entire recruitment process. It tracks candidates from their first view of the job posting until they accept an offer. Use the Applicant Funnel Calculator to see exactly where candidates drop off in your hiring process and identify the stages that need improvement.
SkillSauce's calculator gives you a complete view of your hiring pipeline. You input key data like job views, applicant numbers, interviews conducted, offers extended, and accepted. The calculator then works out conversion rates at each stage. This shows you exactly where candidates leave your funnel.
These tools are a great way to get better results at each stage of your recruitment process. You can spot specific areas to improve by calculating metrics like application completion rate, which averages only 10.6% across industries.
Good tracking helps you make decisions based on data instead of gut feeling. Kyle Lagunas, talent strategist and founder of Kyle & Co., puts it well: "Business speaks the language of data. For recruiting not to speak that language is a major credibility gap".
Understanding the Recruitment Funnel
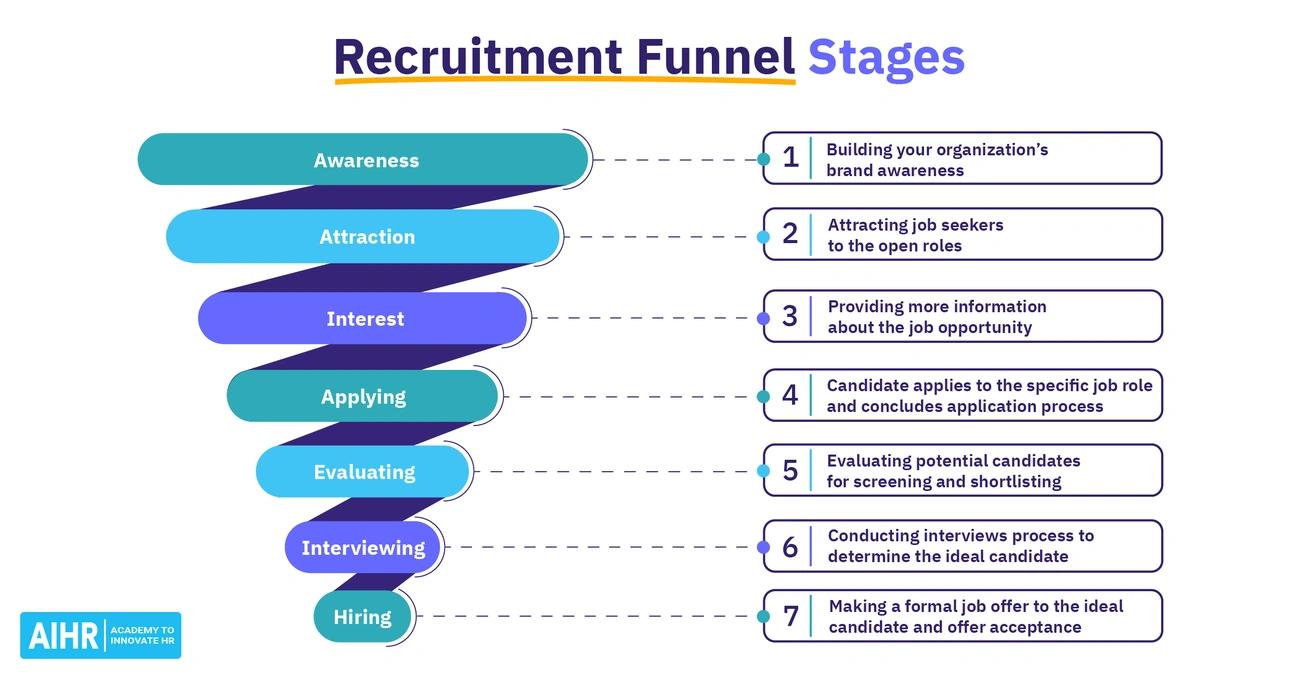
Image Source: AIHR
The recruitment funnel shows how candidates progress through your hiring process visually. Marketing teams track customer paths, and HR departments can map candidates' progress from awareness to hire. This approach helps recruiters identify where talent drops off. Recruiters can optimize their efforts and improve conversion rates at each stage by understanding this structure.
What is a recruitment funnel?
A recruitment funnel defines each stage of your hiring process, from the first candidate awareness to final onboarding. The funnel captures potential candidates at its wide mouth and filters the pool until only the most qualified applicants remain. Recruiters can break down the hiring process into defined stages with specific strategies and measurable outcomes through this systematic approach.
Traditional hiring methods treat recruitment as disconnected steps. The funnel approach recognizes hiring as a continuous process with predictable conversion patterns. The recruitment funnel works like marketing and sales funnels, aiming to convert potential candidates into employees.
HR professionals benefit from this framework in several ways:
- Creates a systematic, scalable hiring process
- Provides clear visibility into each recruitment stage
- Helps make informed improvements to specific stages
- Shows where candidates typically drop off
Stages of the funnel from sourcing to hire
Organizations have different funnel structures based on their industry requirements and size. The typical recruitment funnel includes these stages from top to bottom:
- Awareness: Building employer branding and making potential candidates aware of your company as a place to work
- Attraction: Guiding interested talent toward specific job opportunities through job postings and targeted outreach
- Interest: Providing resources that help candidates learn more about your organization and roles
- Application: Supporting candidates through a user-friendly application process
- Evaluation: Screening applicants through resume reviews and pre-employment assessments
- Interview: Involving shortlisted candidates in structured conversations
- Offer: Extending compelling job offers to final candidates
- Hiring: Completing the process with acceptance and onboarding
Tracking conversion rates between stages reveals your process's strengths and weaknesses. Recruiters can optimize their efforts with proper analysis for maximum effect.
Why funnel metrics matter
Funnel metrics turn your recruitment process from guesswork into an informed operation. "Every change that is made to the recruitment process is a shot in the dark" without these measurements. Stage-by-stage conversion tracking provides applicable information that drives continuous improvement.
Monitoring funnel metrics offers these key benefits:
- Identifying bottlenecks: Pinpointing exactly where candidates drop out of your process, whether at application, screening, or offer stage
- Optimizing resource allocation: Directing recruitment budget toward channels that produce the highest conversion rates
- Improving candidate experience: Enhancing stages with high abandonment rates to keep quality candidates engaged
- Reducing hiring costs: Eliminating inefficiencies that extend time-to-fill and increase cost-per-hire
The value goes beyond process improvements. Matthew Ramirez, CEO at Rephrasely, shares: "We used data to identify bottlenecks in our hiring process and made changes accordingly. We found that the application process was too long, which is why we had high dropout rates. We reduced the application time for candidates to five minutes. And this helped us fill open positions".
SkillSauce's Applicant Funnel Calculator can help you find similar insights to improve your hiring outcomes without increasing application volume.
Spotting Drop-Offs and Bottlenecks
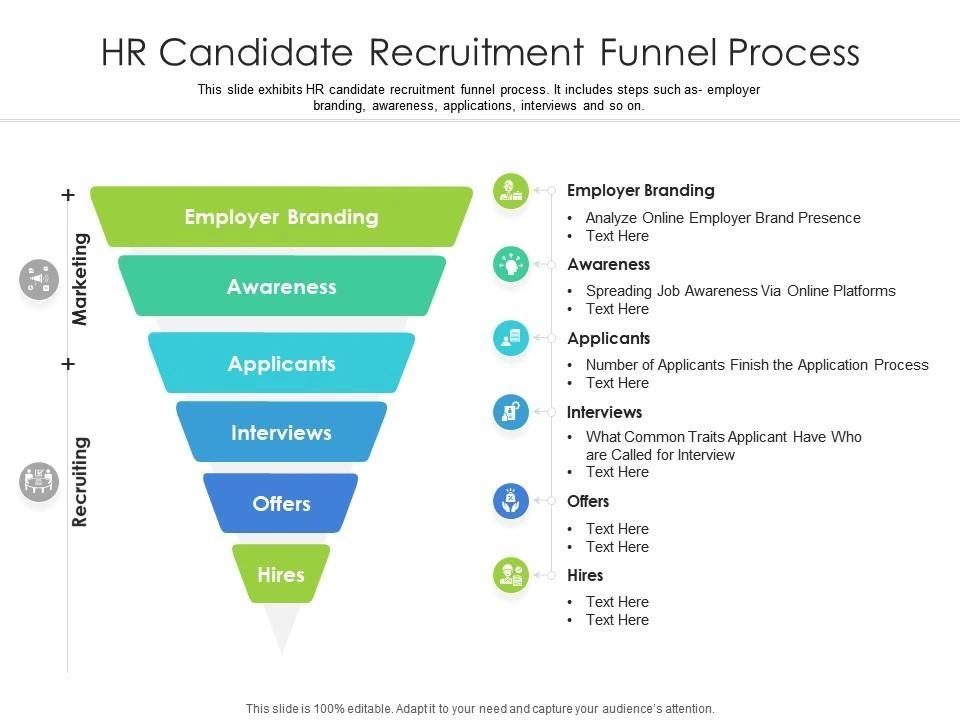
Image Source: SlideTeam
Candidates don't randomly drop off during hiring - they leave at specific points where they face friction, delays, or poor communication. Your recruitment strategy can change dramatically if you know exactly where candidates abandon the process. This knowledge helps improve conversion rates significantly.
Where candidates typically drop off
Each time candidates click away from your application process, it reveals something crucial about their experience. The data shows several common exit points:
- Before the phone screen (50% of candidates won't work for a company with a bad reputation)
- After the phone screen (often when compensation or role details don't meet expectations)
- After requesting an assessment (especially for technical roles where assessments may feel excessive)
- Before/after meeting the hiring manager (possibly showing misalignment on requirements)
- After the onsite interview (where candidates see the company culture firsthand)
- After position is offered (usually due to compensation issues or competing offers)
Research shows 28% of candidates skip interviews or stop communicating during the process, and 10% decline offers after signing. Additionally, 60% of job seekers abandon applications that take more than 15 minutes.
How to calculate stage-to-stage conversion rates
You can find bottlenecks by calculating conversion rates at each funnel stage with this formula: (Entered − Completed) / Entered. This calculation shows where candidates lose interest.
Industry standards show only 34.6% of website visitors become applicants. Just 8.6% of applicants get interviews, while 83% of offers get accepted.
Using funnel data to improve hiring flow
The data helps you make targeted improvements once you spot where candidates leave:
- Simplify application forms (92% of candidates who click 'Apply' don't finish applications)
- Make sure applications work on mobile (40% quit non-mobile-friendly applications)
- Talk about compensation expectations early
- Keep communication clear (47.6% lose interest without feedback within a week)
Use the Applicant Funnel Calculator to see exactly where candidates drop off in your hiring process and identify the stages that need improvement. Your recruitment funnel can keep quality candidates interested through simplified processes based on these patterns.
Using Data to Improve Hiring Efficiency
Making recruitment data into applicable information takes more than just collecting numbers—you just need strategic analysis and application. After gathering your metrics, the real work starts in using this information to lift your hiring process.
Setting your measurement standards
Baseline comparisons help you figure out if your recruitment performance beats, matches, or lags behind expectations. Industry standards give helpful context—average offer acceptance rates sit at 82% in most industries. Technical roles show lower rates than business positions. Companies get about 180 applicants per hire, with big swings between sectors. Here's how to set proper standards:
- Match your metrics with companies like yours in your industry
- Keep an eye on performance trends and seasonal changes
- Set your own internal standards when you can't find external data
Making evidence-based choices
Being good with data helps you back up resource requests and create smarter hiring strategies. Here's how to use analytics well:
- Find bottlenecks through funnel analysis
- Run A/B tests on job descriptions or interview formats
- Put your budget into channels that work best
Using metrics to boost recruiter results
Smart teams balance speed with quality when they check how well recruiters perform. Teams focused only on time-to-fill might hurt candidate quality. Look at how fast recruiters respond to questions and track their interview-to-offer ratio. The best performance indicators tie recruitment results directly to company goals.
Conclusion
Analytics can reshape the scene of your hiring process. This piece explores how tracking the right metrics gives you a clear view of your recruitment funnel. You can pinpoint exactly where candidates drop off and why. These analytical insights help you make targeted improvements instead of randomly changing your entire process.
Eight critical metrics form the core of evaluating recruitment performance - from time to fill and cost per hire to application completion rate and first-year attrition. A centralized dashboard helps you spot trends and identify bottlenecks. Your team can make decisions based on concrete evidence rather than hunches.
Note that recruitment metrics are more than just numbers on a spreadsheet. They tell your candidate experience's story, your recruitment team's effectiveness, and your company's success in attracting top talent. Companies that use data-driven hiring are three times more likely to make quality hires while cutting costs and improving their process.
You don't need to track every data point to see major improvements. Calculate stage-to-stage conversion rates to find exactly where candidates leave your process. Finding that 92% of candidates who click "Apply" never finish applications or that 40% leave when they face non-mobile-friendly forms shows you specific problems to fix.
The Applicant Funnel Calculator gives you a quick way to turn your recruitment data into practical insights. Input your core funnel metrics—from job views to accepted offers—to see your biggest opportunities to improve. This visibility lets you enhance each stage of your recruitment process without increasing application volume.
Tracking meaningful recruitment metrics helps you build a more efficient, candidate-friendly hiring process. You can consistently hire quality candidates while reducing costs. The data is ready—you just need the right tools to realize its potential.
Key Takeaways
Understanding and tracking the right recruitment metrics can dramatically transform your hiring outcomes, reduce costs, and improve candidate experience throughout your recruitment funnel.
• Focus on 8 critical metrics: Time to fill, time to hire, source of hire, cost per hire, quality of hire, offer acceptance rate, application completion rate, and first-year attrition provide comprehensive recruitment insights.
• 92% of candidates abandon applications: Most drop-offs occur at predictable stages, with mobile-unfriendly applications causing 40% abandonment rates—making application optimization crucial.
• Use data to identify bottlenecks: Calculate stage-to-stage conversion rates to pinpoint exactly where candidates exit your funnel and make targeted improvements rather than overhauling everything.
• Implement centralized tracking: A recruitment metrics dashboard provides transparency across teams and enables data-driven decisions that are three times more likely to result in quality hires.
• Benchmark against industry standards: Average cost per hire is $4,000, offer acceptance rates hover around 82%, and first-year attrition affects 38% of new hires—use these baselines to evaluate performance.
The key to recruitment success lies not in tracking every possible metric, but in focusing on the data points that directly impact your hiring outcomes and candidate experience. With proper tracking tools and consistent measurement, you can transform recruitment from guesswork into a predictable, efficient process.